What is Land Cover?
Land cover, as its name implies, shows the "covering" of the landscape. This is different from land use, which is what is permitted, practiced or intended for a given place. For example, a "forested" land cover area as detected by the satellite may appear as "rural residential" or "open space" on a town zoning map. CLEAR's land cover information comes from remotely sensed imagery from satellites, in this case several of the Landsat satellite series. Sensors aboard the satellite collect (sense) light in a number of different wavelengths that is reflected from the surface of the earth. The data are converted via computer programs and human expertise into land cover maps made up of many pieces, or pixels, of information that are 30 meters (or about 100 feet) square. Although remotely sensed land cover maps have been around for quite some time, comparing different land cover datasets has been difficult. Satellite sensors are continually evolving along with the land cover information derived from them. Land cover derived from images from different years taken by different sensors (and perhaps at different times of the year) normally cannot be compared directly with any claim of accuracy. CLEAR's challenge was to solve this "apples and oranges" problem by using a technique called "cross-correlation analysis." This allows us to provide state citizens and decision makers with reliable, comparable information which shows how Connecticut's landscape has changed over the last 30 years. Maps from seven dates (1985, 1990, 1995, 2002, 2006, 2010 and 2015) were created, and can be explored in various ways on this website.
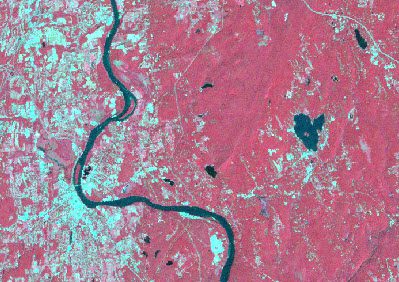
Landsat satellite image displayed showing three of it's seven continuous bands (near-infrared, red and green).
Image processing and classification using computer techniques.
![]()
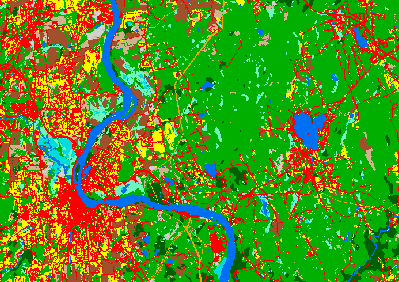
Land cover thematic map with 12 discrete and quantifiable categories.
Funding
This project was funded by the federal/state partnership Long Island Sound Study (LISS), a National Estuary Program. It is intended to give resource managers, researchers, and the public information about the way the landscape draining into the Sound has changed over the time period from 1985 to 2015. Because this time span is approximately the same as that of the LISS itself, it is a particularly apt dataset for those seeking insight into the land use-derived challenges to the health of the Sound, and our joint progress toward meeting these challenges. This study is an update and a geographic expansion of CLEAR’s Connecticut’s Changing Landscape project, which has been ongoing since 2004.